

Skill Share Session #2: Using R on the NorFish project
Author: John Nicholls
The early July Skill Share gathering provided an opportunity to explore the “R” programming language, especially in terms of visualising data in literal and practical terms. The topic ranged from installing and loading helpful libraries to creating maps and graphs of research data. The underlying emphasis was on exploring the data in a visual format which could enable fault-finding and data clean-up processes that can both inform and validate advanced analytics.
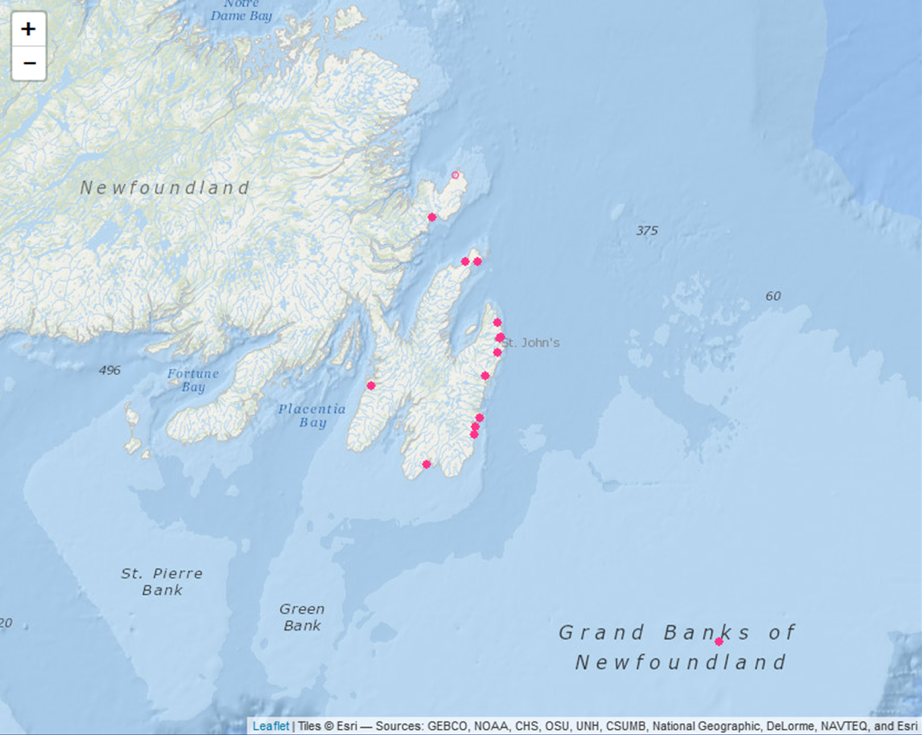
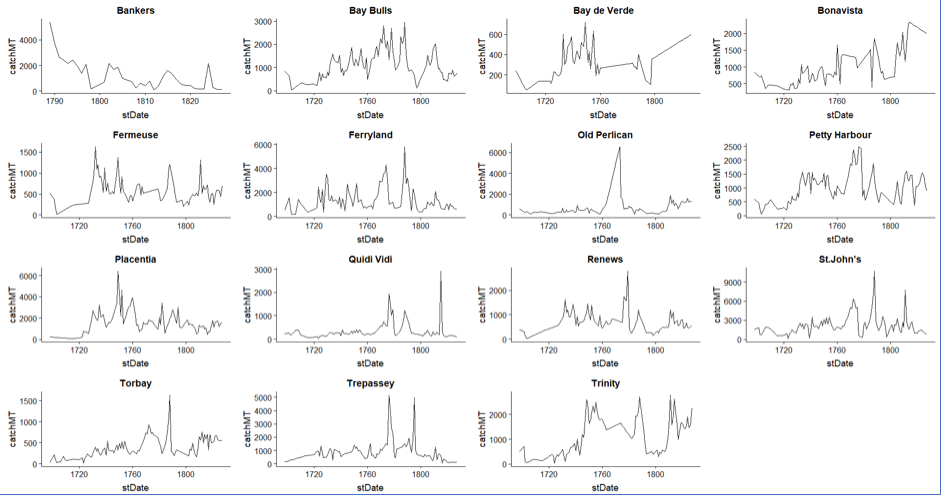
By creating a visual, coordinate linked map, data points can by visually confirmed while spurious “outliers” can be easily identified and located within the actual data. However, the chronological element needed to be addressed as well, and this was achievable through multiple graphs which plot variables defined by the user. For example, a series of timeline graphs depicting individual fishing ports based on the metric tonnage of landed fish displays a series that can help to visually identify trends, highlight shortfalls in data provision, and even provide clear images that can be used in presentations and papers for publication.
Despite a focus on Norfish output data relating to Late Medieval and Early Modern Fisheries, these methods and applications can be used in a large variety of research disciplines. The approach underpins the Norfish ethos of bringing together the Sciences and Humanities as coherent and necessary interdisciplinary collaborators.
John Nicholls, July 2018