The budget costs of the CAP have been one of the major driving forces of CAP reform in the past. From the point
of view of taxpayers, budget costs are indeed important, but the earlier lecture on the welfare
analysis of agricultural policies should have convinced you that they are just one component of the overall
costs. In this lecture, we see how the methodology introduced in Lectures 11 and 13 can be applied to measure both the overall transfers and costs to the EU resulting
from the CAP, as well as the costs (or benefits) to individual member states. The benefits of the CAP to Ireland
have been a major attraction of EU membership to Ireland in the past. In this lecture, we review some recent work
which suggests that popular discussion of the size of these benefits, by focusing on the cost of the transfers
to Ireland, have exaggerated their actual benefit to this country.
Thus the lecture objectives are to understand:
The costs and transfers arising from the operation of the price support element of the CAP for the EU as a whole can be estimated by applying the standard partial equilibrium analysis of an export subsidy (for export commodities) or an import tariff (for imported commodities). If each Member State financed its own transfers to its own farmers, the same analysis would apply at the Member State level. However, the market support costs of the CAP are borne not only by domestic consumers and taxpayers but also by EU taxpayers and consumers. For example, direct payments to farmers are financed centrally by the FEOGA Guarantee budget, and the burden of financing these payments is distributed across member states in accordance to their contributions to the EU budget (very approximately, in accordance to the relative size of their GNPs). Also, the cost of paying higher prices on a country's exports of CAP products is paid either by other EU consumers (if exported to another EU Member State) or again by the FEOGA Guarantee budget (if exported outside of the EU). This financing system, by driving a wedge between the benefits from CAP expenditure and its costs to individual Member States, means that the CAP results in a significant redistribution of resources between the Member States.
Consider the following figure which depicts an exporting Member State with an export subsidy in place at EU level to raise EU prices above the world market price. Part of its exports are sold to other EU countries (intra-EU trade) and part is sold outside the EU to third countries (extra-EU trade). We assume that the EU can be analysed in small country terms, though this assumption can be relaxed later. The welfare analysis for this country shows that consumers lose the amount (a+b) while producers gain the amount (a+b+c+d). In this case, the cost to the taxpayer of the export subsidy is not the usual calculation of the export volume times the unit subsidy. This cost is paid by the rest of the EU, and it is the country's share of the overall EU expenditure on the export subsidy which should be debited to this country. For the moment, assume that we are discussing a small Member State (such as Ireland, whose share of EU budget expenses is around 1%) and that this contribution to the EU budget can be ignored. In this case, the benefit of the CAP to this small exporting member state is measured by the area (c+d). For a large member state, of course, its share of total EU export subsidy spending could be very substantial.
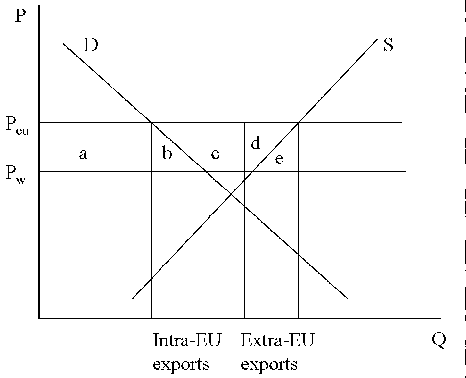
Examine more closely the way in which this country's export prices are supported. For products sold outside the EU (extra-EU trade), the country receives an export subsidy transfer from the FEOGA Guarantee budget to make up the difference between the EU and world market price (equal to the area d+e). We refer to this as the budget transfer. However, no export subsidy is payable on trade between EU countries. Instead, the effect of the Community preference aspect of CAP protection is to ensure that other EU consumers must pay the high EU price, rather than the lower world price, when importing from an exporting Member State. As a result of the CAP, an exporting country receives a terms of trade gain (i.e. its export prices are higher than they would have been in the absence of the CAP) equal to the area b+c. We refer to this as the trade transfer (or the preferential trade effect). If we are only interested in measuring transfers, then we simply add together the budget and trade transfers to get the overall transfer to this country from the CAP. However, if we ask how much better off this country is as a result of the CAP, we need to substract the deadweight cost triangles. For an exporting member state, the overall real income gain from the CAP equals the area c+d.
In saying this, we are assuming that the alternative to this country being part of the CAP price support regime is free trade. However, for some countries, it is possible that, if the country withdrew from the EU, it would wish to continue with a policy of agricultural support. If the alternative to the CAP was simply a nationally-financed agricultural policy which maintained prices at the same level, then the overall real income gain from being an EU member and participating in the CAP is actually b+c+d+e. This illustrates a very important point in policy analysis that the measurement of benefits and costs must always be relative to some alternative policy scenario. This may well be free trade, as economists often wish, but in the real world it may not be.
The converse argument applies in the case of a net importing Member State. Imports can be sourced either from third countries (extra-EU imports) or from other EU countries (intra-EU imports). For imports from outside the EU, the tariff and variable levy revenue which would normally accrue to the country must be handed over to the EU as part of the EU budget's own resources. For imports from other Member States, the country must pay the high EU price and thus suffers a terms of trade loss on its imports, compared to the alternative of importing them at world market prices. Thus, an importing EU member suffers the double indignity of not only paying more for its own food imports as a result of the CAP, but also contributing to the EU agricultural budget to pay for the export subsidies paid to the net exporting EU Member States!
The most important extension is to relax the assumption that the EU is a small economy in the world market. If we allow for the fact that the EU support system depresses the level of world prices, and thus turns the terms of trade against the EU as a net exporter of foodstuffs, then we have an additional terms of trade loss to be subtracted from both the measured gains of net exporting member states and the measured losses of net importing member states. This topic is explored further in Lecture 17.
A complicating factor in CAP reform is that any proposal to change the level of price support to farmers not only affects the distribution of income between farmers, consumers and taxpayers within a country but also affects the distribution of costs and benefits between member states. Thus a reform which would benefit the Union as a whole may be opposed by one or more member states because it reduces the net benefits from the CAP of net exporting countries. The implications of the MacSharry/Agenda 2000 reform approach of substituting direct payments for market price support can be evaluated using the figure above (representing a net exporting member state) and the figure below (representing the EU as a whole). (For the purpose of this exercise, think of the world price line Pw as the new internal market price following the reduction in support prices, i.e., it corresponds to the line Peu' in the figure below).
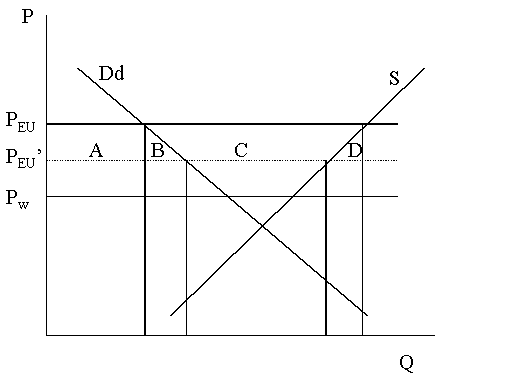
We make the assumption that the direct payment compensates exactly for the loss in farm revenue due to a reduction in market support prices. We also assume that the payments are coupled to production so that
there is no change in the effective price which farmers receive and they continue to supply the same amount as with market price support. Then, looking at the first of the two
figures representing the net exporting member state, the consequences of a MacSharry/Agenda 2000 reform are as
follows.
Let s = member state's share of EU budget contributions
Change in producer surplus = 0
Change in consumer surplus = (a+b)
Change in government revenue
|
= |
s * (cost to EU of original export subsidy - cost to EU of direct payment) |
|
= |
s * [(B+C+D)-(A+B+C+D) |
|
= |
s * -A |
t * A - s * A
In other words, a member state benefited overall from the MacSharry/Agenda 2000 reform where its share of EU consumption of a product was greater than its share of EU budget revenue. Conversely, member states with larger budget than consumption shares lost out.
At the time of the Luxembourg Agreement, member states decided to avoid re-opening distributional quarrels and agreed that each country's entitlement to money for the Single Farm Payment would simply be the sum of the payments it was already receiving for the various coupled farm payments. Thus countries which did well under the old system continue to do well under the Single Farm Payment. The proposal to modulate some of the Pillar 1 money and transfer it to rural development expenditure under Pillar 2 would have resulted in some redistribution, which was largely avoided by requiring that at least 80% of the modulated funds would be spent in the country where they originated. While the distribution of direct payments broadly reflects the distribution of agricultural area and of livestock between member states, it also reflects the combination of the specialisation of member states in specific agricultural sectors and differences in the way support was provided to these sectors. The following diagram shows that France gets a greater share of the direct payments and the UK somewhat less than their share of agricultural activity, while Ireland does better relative to its agricultural area but less well compared to its share of total livestock.
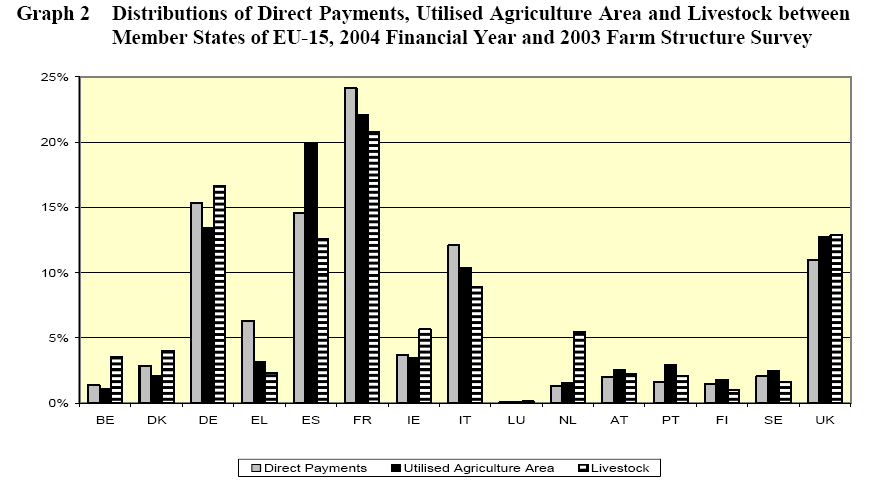
Source: DG Agri, Report on the Distribution of Direct Aids to Producers, Financial Year 2004.
Although the methodology to derive a country's net position arising from the CAP is clear, making the calculation in practice is controversial, largely because of the uncertainty over how to value the preferential trade transfer. The size of this transfer depends on the difference between the CAP market price and the world market price (as shown in the diagrams), but there can be many different views on the appropriate world market prices to use in this analysis. One convenient benchmark is to use the OECD framework for the calculation of each country's Producer Support Estimate (PSE) because, in calculating the market price support element of the PSE, the OECD has decided on an appropriate world reference price. However, at best this represents the current (distorted) world market price, and thus is likely to overestimate the extent of transfers relative to a free trade non-CAP scenario. This is the approach used in the Zanias paper.
One estimate of the resulting redistribution of gains and losses betwen member states is
shown in Table 30 of the EU Commission report referenced below. The
table is divided into two parts. The top half measures the transfers arising from both budget flows to and from Member States and the trade effect. As always with the
measurement of transfers, the positive and negative transfers sum to zero. Note that Ireland, despite having only
a 1% share of EU GNP, is estimated to have the highest absolute level of positive transfers after the Netherlands.
The second half of the table measures the real income effects (i.e. taking into account, in addition, the deadweight
costs in each country). It shows that the overall increase in EU farm income amounts to ECU 28.6 billion, while
the overall economic cost amounts to ECU 13.7 billion, i.e. nearly half of the transfer from consumers and taxpayers
is used up in actually making the transfer, so that the transfer efficiency is just over 50%. It also shows that
the net gain to Ireland is reduced from ECU 1.6 billion to ECU 0.4 billion when these deadweight costs are taken
into account.
Matthews provides more recent estimates of the size of EU CAP transfers to Ireland which
he puts at around £2.0-2.1 billion annually in gross terms (i.e. before allowing for the Irish contribution
to the EU budget). By adding in the transfers from Irish taxpayers and consumers, and comparing this total transfer
to the actual value of support received by Irish farmers, he is able to provide an estimate of the costs and leakages
in making these transfers. He concludes that more than one-third of the transfers (36%) do not reach their intended
beneficiaries. Nonetheless, because two-thirds of the cost of these transfers are paid by EU consumers and taxpayers,
there is still a significant positive gain to the Irish economy from participation in the CAP.
Zanias provides the most recent estimate of the distribution of the transfers between member states arising from the operation of the CAP. He calculates these transfers using the following equation:
![]()
where the first term represents the net direct budgetary transfer (calculated as the difference between direct payments received minus the budgetary contribution to financing the CAP), and the second and third terms represent the resources transferred through trading at higher EU prices P rather than world prices Pw (the second term represents the resources transferred through intra-EU trade, paid by consumers, and the third term the resources transferred through extra-EU trade (export subsidies paid in the case of an exporting member state, or import tariffs transferred in the case of an importing member state). His results show that, over the period of his study 1988-2003, Ireland was by far the largest beneficiary of the CAP (measured relative to the gross value added in agriculture).
The Commission has now begun to publish figures on the distribution of payments between farmers both at EU level and by member state. These are now published anonymously, but there is now political agreement to publish the names of individual recipients of direct aids from 2009 onwards. Some member states (but not Ireland) have already begun to do this, as collated on a Commission webpage. Remember, of course, that direct payments are only one source of support to farm incomes. There are also transfers to farmers through higher consumer prices. To get a full picture of the distribution of farm programme support, it would be desirable to include estimates of the distribution of market price support as well as direct payments.
Zanias, George P. (2005), Who Benefits from the CAP?. In European Union Studies Association (EUSA), Biennial Conference 2005 (9th), March 31-April 2, 2005, pages 19, Austin, Texas.,
Zanias, George, 2002, The Distribution of CAP Benefits among Member States and the Impact of a Partial Re-nationalisation: A Note, Journal of Agricultural Economics, 53, 1, p. 108-112. (available through Trinity Library E-Journals).
Wichern, R., 2004, Economics of the Common Agricultural Policy, European Economy Economic Papers No. 211, August 2004
(This is a large download 2.5 MB. However, read Sections 3.1 and 3.2 only; if you want to print this off, print pages 21-29 )
Supplementary references
EU Commission, 1994. EU agricultural policy for the 21st century. European Economy No. 4, Reports and Studies, 1994. See Chapter B, Section 4.1 'Transfer and real income effects of the CAP'. LEN 338.1094 N42.
Irish Department of Agriculture and Food, Annual Review and Outlook 20003/2004, See Chap 7-2 'Benefits of CAP to Ireland'.(note that this section was discontinued in the 2004/05 Review and Outlook).
Matthews, A., 2000. Farm Incomes: Myths and Reality, Cork University Press, Chapter 4 'The cost of subsidising farmers'.
DG Agri, Report on the Distribution of Direct Aids to Producers, Financial Year 2004.
The underlying 2004 tables are published separately.
Links to the Commission reports for 2002-24 (see right hand column)
Baldwin, R., 2005, Who finances the Queen's payments? The CAP as a dooH niboR scheme, CEPS Policy Brief No. 88, London.
See also the website www.farmsubsidy.org dedicated to revealing who gets what from the CAP.